Reducing corruption in public procurement
 Female official refuses to take bribe, anti-corruption laws in action. Motortion Films / Shutterstock.com
Public procurement is vulnerable to corruption (Olken 2007, Collier et al. 2016, Lichand and Fernandes 2019, Colonnelli and Prem 2020). Estimates of bribes range from 8% to 25% of the value of procured goods, services, or works. For example, a recent EU study found that inefficiencies in public procurement amount to 18% of the overall project budgets concerned, two-thirds of which can be attributed to corruption.
While governments have traditionally attempted to mitigate corruption risks in public procurement through regulation, the latest research (for example, Bosio et al. 2020) shows that laws on their own are largely ineffective at reducing the risk of bribery. Instead, more focus should be placed on procurement practices, as these are highly correlated with corruption (Figure 1). In particular, the main focus of anti-corruption efforts can be directed towards some specific features of procurement practice.
Figure 1. Procurement practices as a focus of anti-corruption efforts
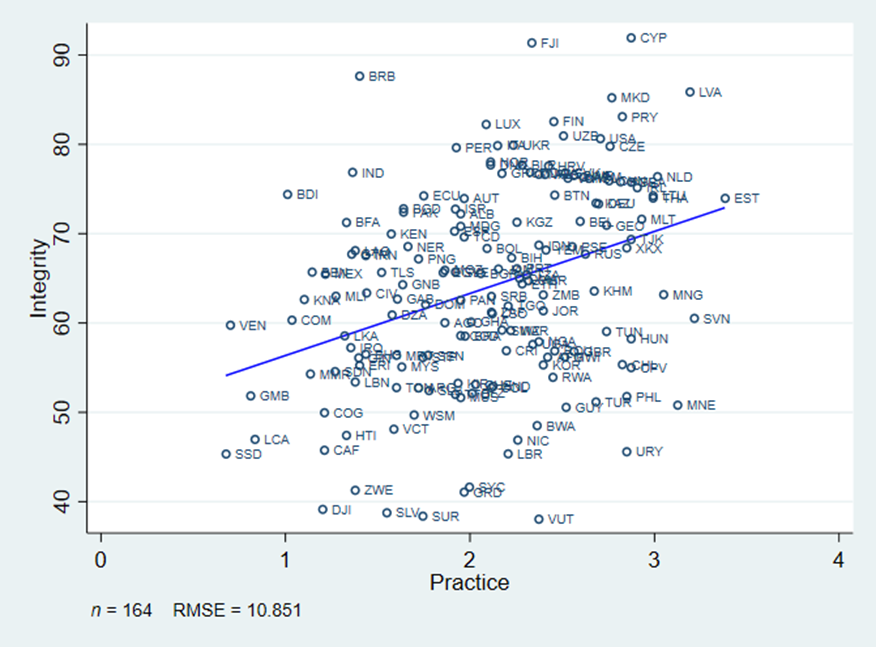
Note: The Integrity measure comes from Fazekas (2021) and is based on the ProAct database of procured contracts in 170 countries developed with the support of the World Bank. It is a measure of corruption. Practice is an index of procurement practices developed in Bosio et al. (2020).
Source: Fazekas (2021) and Bosio et al. (2020).
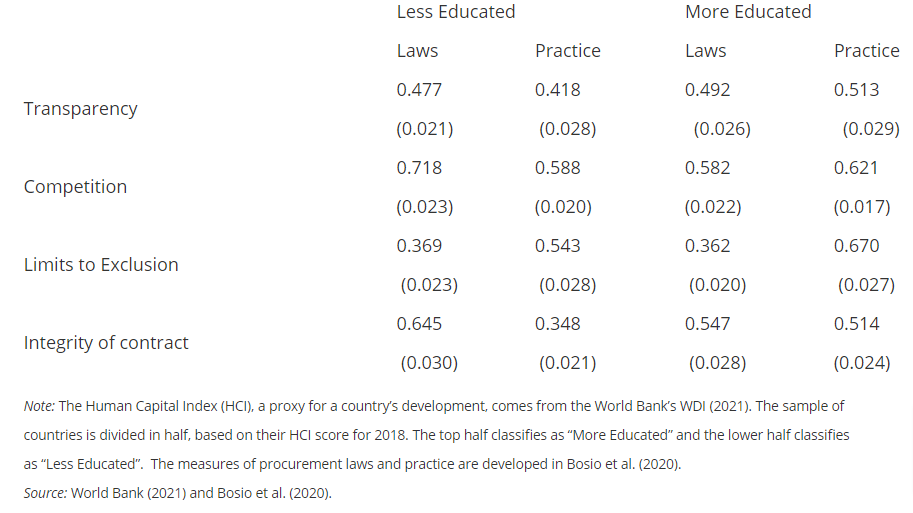
To benchmark public procurement laws and practices, Bosio et al. (2020) use an index that documents the extent of public procurement regulation in four areas: (1) transparency; (2) competition; (3) limits to exclusion; and (4) integrity of contract. Data on transparency tests the level of public availability of key documents. Questions on competition examine which rules are in place to broaden participation in the tendering process. Data on the limits to exclusion gauges whether there are rules in place that make it more difficult for the procuring entity to exclude bidders. Finally, questions on the integrity of the contract ask about events that may take place during the life of the contract, including payment, the ability to add subcontractors, renegotiation after the contract is signed, as well as change in project specifications.
To benchmark procurement practices, Bosio et al. (2020) use measures that test whether and how procurement practices differ from the laws in the same four areas. Procurement laws and practices can sometimes differ significantly. I find that low income countries regulate more, but their practices lag. In contrast, high-income countries regulate procurement less than poorer ones by law, but have practices that are more expansive than their laws. In low-income countries, laws are stricter than practice for transparency, competition, and integrity of contract, though not for limits of exclusion (Table 1). In high-income countries, laws are less binding than practice for transparency, competition and exclusion, though not for the integrity of contract.
As far as transparency is concerned, for example, the law in the United Kingdom requires Procuring Entities (PEs) to prepare annual procurement plans but does not mandate their publication, yet PEs choose to put them on their website. Similarly, as far as competition is concerned, the use of open tendering is discretionary in France, but the PE introduced a guideline—not mandatory, but strictly followed in practice—imposing the use of open tendering for all contracts above €1,000,000.
To proxy corruption, I use a measure derived from ProACT – a newly launched World Bank database compiling contract-level data on millions of actual procurement contracts across 170 countries (Fazekas 2021). I find that Integrity is robustly and positively correlated with practice in all four areas measured. Improving procurement practices in each of the four areas measure reduces corruption.
Table 1. Efficient public procurement practices reduce corruption
(average and standard deviation over possible 1.00 of the respective laws and practice)
International institutions can help by promoting these practices and also by assisting governments in implementing different levels of regulation depending on public sector capacity, thus bringing a customized solution. Rewards are large, as public procurement accounts for 12 percent of global GDP, equivalent to approximately $11 trillion (Figure 2).
Figure 2. Public procurement accounts for 12% of global GDP, 2018
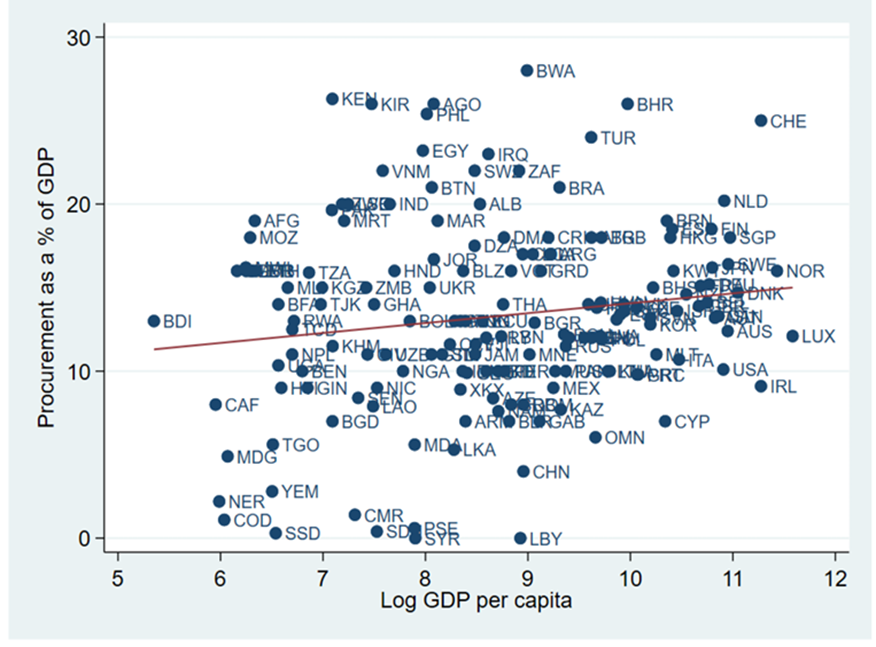
Note: Log GDP per capita comes from the World Bank’s WDI (2021). Procurement as a share of GDP is a measure developed in Bosio et al. (2020).
Source: World Bank (2021) and Bosio et al. (2020).
Even using the most conservative estimate from the existing empirical literature, 8% of the value of procurement contracts (or approximately $880 billion) – more than 5 times developmental aid disbursed in 2019 – is lost to corruption. This research suggests that projects aimed at improving procurement practices in developing economies can contribute to reducing that number.
References
Bosio, Erica, Simeon Djankov, Edward L. Glaeser & Andrei Shleifer. 2020. Public Procurement in Law and Practice. NBER Working Paper 27188.
Collier, Paul, and Martina Kirchberger. 2016. The Cost of Road Infrastructure in Low- and Middle-Income Countries. World Bank Economic Review 30, no. 3: 522–48.
Colonnelli, Emanuele, and Mounu Prem. 2020. Corruption and Firms. accessed on July 21, 2021.
Fazekas, M. 2021. GTI’s Global Government Contracts database. July 19.
Lichand, Guilherme, and Gustavo Fernandes. 2019. The Dark Side of the Contract: Do Government Audits Reduce Corruption in the Presence of Displacement by Vendors? University of Zurich, Switzerland, mimeo.
Olken, Benjamin. 2007. Monitoring Corruption: Evidence from a Field Experiment in Indonesia. Journal of Political Economy 115, no. 2: 200–49.